Translate this page into:
Point-of-care lactate as a predictor of 7-day morbidity and mortality in critically ill patients presenting to the emergency department in Kenyatta National Hospital
*Corresponding author: Peris Mbatha Mutuku, Department of Clinical Medicine and Therapeutics, University of Nairobi, Nairobi, Kenya. mbathaperis@gmail.com
-
Received: ,
Accepted: ,
How to cite this article: Mutuku PM, Joshi MD, Genga EK, Kagima JW. Point-of-care lactate as a predictor of 7-day morbidity and mortality in critically ill patients presenting to the emergency department in Kenyatta National Hospital. J Pan Afr Thorac Soc 2023;4:115-23.
Abstract
Objectives:
Hyperlactatemia is associated with increased risk of mortality. Point-of-care (POC) lactate levels have been used worldwide in the emergency department (ED) and critical care units for risk stratification. The aim of this study was to determine whether POC lactate levels are predictive of outcomes in our low-resource setting.
Materials and Methods:
This was a non-interventional prospective cohort study carried out at the ED Critical Care wards in Kenyatta National Hospital between June 12, 2021, and July 25, 2021. The study included consecutively consenting adults above 18 years at the ED who were critically ill as indicated by a Modified Early Warning Score of equal to or above 5. Lactate was measured using a handheld Statstrip lactate meter. Patients were followed up for 7 days, and outcomes were documented.
Results:
Two hundred and eighty-one patients were enrolled in the study. The mean lactate level was 4.0 mmoL/L with a median interquartile range of 3.0. Hyperlactatemia was evident in 161 (57%) using a cutoff of 2.5 mmoL/L. The all-cause mortality rate was 33.8%. Type A hyperlactatemia was the most common at 84.3% and 17.7% in Type B. Type A hyperlactatemia mortality rate was 37.1% and Type B 15.9% (odds ratio [OR]: 3.1, 95% confidence interval [CI]: 1.3– 7.3, P = 0.006). In the high lactate group, the 7-day mortality rate was 42.2% compared to a mortality rate of 22.5% in the normal lactate group (OR: 2.5, 95% CI: 1.5–4.3, P = 0.001). Hyperlactatemia was associated with an increased need for intensive care unit admission (OR: 2.2, 95% CI: 1.3–3.7, P = 0.002) and organ support mainly mechanical ventilation (OR: 2.6, 95% CI: 1.5–4.4, P = 0.001) and inotropic/vasopressors support (OR: 2.7, 95% CI: 1.2–6.2, P = 0.016).
Conclusion:
POC lactate is an independent predictor of 7-day mortality with a 2-a fold increased risk of mortality and was associated with increased need for organ support.
Keywords
Hyperlactatemia
Morbidity
Mortality
Critical illness
Organ support

INTRODUCTION
Hyperlactatemia is a lactate level >2 mmoL/L. Lactate is made in the body by various organs and is metabolized mainly in the liver and partly in the kidney.[1] During glycolysis, the pyruvate produced enters the Krebs cycle, but under anaerobic conditions lactate produced is channeled to the Cori cycle for Gluconeogenesis.[2] In stressful conditions, for example, critical illness surplus pyruvate builds up and is converted to lactate so that glycolysis can continue.[3] Lactate is a significant metabolic intermediate that is crucial in maintaining mitochondrial ATP yield during critical illness. Lactate production during circulatory shock is due to increased glycolysis in the skeletal muscle, while, in systemic inflammatory response and sepsis, it is due to production of lactate by tissue macrophages and inflammatory cytokines. Hyperlactatemia is a consequence of enhanced aerobic glycolytic flux.[4] Vary et al. found that IL-1 infusion resulted in hyperlactatemia, a rise in skeletal muscle lactate, and decreased pyruvate dehydrogenase in skeletal muscle.[5]
Hyperlactatemia is linked with high mortality of up to 30% in critically ill patients.[6] It has been found that the mortality rate was directly related to lactate levels within 72 h of admission.[7] The rate at which lactate is cleared in the body has a prognostic value as described in several studies hence the need for repeated lactate levels.[1] In these severely ill patients, there is enhanced glycolysis.[1]
Several causes of hyperlactatemia have been documented in the previous studies such as clinical shock syndromes, post-cardiac arrest syndrome, regional tissue ischemia, diabetic ketoacidosis (DKA), drugs and toxins, anaerobic muscle activity, thiamine deficiency, malignancy, liver failure, and mitochondrial disease.[2] Hyperlactatemia has been classified into Type A which is a result of tissue hypoxia and Type B which is nonhypoxic. The postulated mechanisms for the development of hyperlactatemia are as follows; tissue hypoxia/hypoperfusion increased lactate production and decreased lactate clearance.[8]
Point-of-care (POC) testing has been adopted in the emergency department (ED) and intensive care units (ICUs) worldwide. POC lactate test is a bedside test that is very cost-effective and easy to perform. It is good for risk stratification of critically ill patients. It has a turnaround of 13–30 s compared to central laboratory methods which take 30–60 min to obtain results.[9] There are documented better outcomes while using the POC lactate test since it informs about early treatment strategies thus reducing mortality and the need for critical care unit admissions.[10] POC lactate has been recommended in sepsis guidelines due to its good turnaround time and its ability to diagnose patients with tissue hypoxia at risk of death.[11]
This is the first study in Kenya that assesses POC lactate in critically ill patients. In the study by Edward et al. in Tanzania on POC–lactate in unselected critically ill patients at the ED, they reported association of hyperlactatemia with adverse outcomes.[12] This study was designed to determine the association of POC hyperlactatemia with 7-day morbidity and mortality, classify causes of hyperlactatemia into Type A and B, and determine morbidity and mortality stratified to the type of hyperlactatemia.
MATERIALS AND METHODS
Study design, period, and location
This was a prospective cohort study done between June 12, 2021, and July 25, 2021, at Kenyatta National Hospital (KNH) the largest teaching and referral facility in Kenya. It has a bed capacity of 1800 patients. The study was carried out in the ED resuscitations rooms/critical care wards which have a capacity of 12 beds. There are approximately 400 patients seen in the resuscitation rooms per month. Patients who are critically ill and require cardiac monitoring and close observation are seen and stabilized in the resuscitation rooms before transfer to the wards or ICUs.
Study population, inclusion, and exclusion criteria
The study included all patients in the critical care wards at the ED at KNH
We included all adults aged 18 years with Modified Early Warning Score (MEWS) equal to or more than 5 admitted through the ED who consented to the study. We excluded patients transferred to another hospital after admission.
Sample size calculation
The calculation was done using the Fleiss formula (Fleiss et al., 2003).[13] This study compared mortality in high lactate and normal lactate groups of patients (outcome 1) and also compared mortality in the High lactate group stratified by type of hyperlactatemia (outcome 2).
Using a study by Filho et al.,[14] mortality in the comparison group(normal lactate) was 5.8% and in the study group (high lactate) 16.9% for outcome 1. A study by Andersen et al. was used for outcome 2, mortality in the comparison group with high lactate in Type B was 12.5% while mortality in the study group with high lactate in Type A was 45.8%.[2]
It has been shown in the previous studies that most high lactate patients are Type A (75%) while Type B contributes 25%.[2] Therefore, a sample of 128 high lactate patients gave an estimated number of 96 Type A patients (75%) and 32 Type B patients (25%). This study used the sample size for outcome 1 (n = 256) which was sufficient to achieve outcome 2. Hence, the sample size in each group was 140 (a total of 280 patients).
Sampling and recruitment
A consecutive sampling technique was used to enroll participants in the study. Patients were recruited within 3 h of admission to the ED critical care wards. Patients who gave informed consent or consent was obtained from the next of kin for patients unable to give consent were enrolled. MEWS was calculated after taking vital signs and a patient with MEWS equal to or more the study than 5 was enrolled, and their lactate level was taken.
Data collection procedures
Data collection at the ED
Vital signs, including blood pressure, heart rate, respiratory rate, temperature, alert, verbal, pain, unresponsive score, Glasgow Coma Scale (GCS), and oxygen saturation, were assessed using standard methods by the principal investigator (PI) and research assistants.
A structured electronic researcher-administered tool was used to obtain information on demographic data (age and gender), clinical history, physiological parameters, laboratory tests, and discharge/death working diagnoses.
Primary outcome
Morbidity
7-day Morbidity
ICU admission
Need for close monitoring or organ support recommended and documented by the clinician, actual admission, or/and recommended and documented by the attending clinician.
Organ support
Need for mechanical ventilation
Need for inotropic support or vasopressors
Need for replacement therapy (Renal, liver, or plasma exchange).
Mortality
7-day mortality.
POC lactate test in the ED
A handheld POC lactate machine (The Nova Stat Strip Xpress Lactate Meter System SN 1450732119031 lactate meter strip expiry date March 05, 2022,) manufactured by Nova Biomedical was used to do the test. It uses a single-use test strip that has enzyme coated electrode. The finger was cleaned with an alcohol swab, then using a disposable lancet finger prick was performed to obtain capillary blood which was then fed to the lactate strip which was connected to the POC lactate machine. A lactate level was obtained and recorded. The lactate value obtained was entered into the data collection tool. The machine was calibrated by PI and research assistant(s) every morning using a factory-supplied calibration strip and tested using a check strip with a known value before use as per manufactures instructions. Research assistants were trained in sample collection and the use of POC devices.
Classification of hyperlactatemia (ED and Ward)
ED and post-admission ward round diagnoses were used to classify causes of hyperlactatemia. We split patients into two groups a high lactate group which had a lactate >2.5 mmoL/L and a normal lactate group with <2.5 mmoL/L. A cutoff of 2.5 mmoL/L was used as per Filho et al. which demonstrated high sensitivity and specificity for mortality.[14] We divided the etiology into two groups. Type A was those with evidence of tissue hypoxia/hypoperfusion and Type B was automatically those with no tissue hypoxia. We considered the following causes to be Type A hyperlactatemia: Shock syndromes (cardiogenic, hemorrhagic, hypovolemic, distributive, and obstructive) shock, post-cardiac arrest syndrome sepsis, regional ischemia, seizures, severe hypoxemia (Oxygen saturation <90 OR cyanosis), and severe anemia hemoglobin level <5 g/dL (as documented in the file).
Type B hyperlactatemia causes that we considered were drugs (e.g., Biguanides, acetaminophen, linezolid, beta-2 agonist, theophylline norepinephrine, and epinephrine), infection without sepsis, acute and chronic liver disease, diabetes ketoacidosis/, toxins (alcohol and cocaine), and malignancy among others causes that will have no evidence of hypoxia. Shock was defined as systolic blood pressure <90 or mean arterial pressure <65 while sepsis was defined using systemic inflammatory response syndrome (SIRS) criteria with documented or suspected infection, SIRS criteria were any of these two parameters (A temperature of >38°C or <36°C, heart rate >90, respiratory rate >20, leukocytosis >12*109/L, or leukopenia <4*109/L).
Follow-up in the ward
Patients were followed up daily in their respective wards of admission and outcomes were documented. On the 7th day post-admission, we documented whether the patient is alive or dead, discharged, or still in the ward. Patients discharged before 7 days were contacted and where necessary the next of kin was contacted to obtain information on the patient’s progress. A discharge diagnosis was documented. Throughout the data collection and analysis, measures to prevent Coronavirus disease 2019 transmissions such as the use of sanitizers, hand washing, wearing a facemask, and gowning or other personal protective equipment, as well as physical distancing by the PI and research assistant(s), were observed.
Statistical analysis
Data were coded, entered, and managed in Microsoft Excel 2016 data entry sheet. Cleaned data were exported into SPSS version 23.0 for analysis. Descriptive analysis was done by summarizing the sociodemographic and clinical characteristics of patients into percentages for categorical variables and means or medians for continuous data. Morbidity and mortality were determined for both groups of patients and presented as percentages with a 95% confidence interval (CI). Comparison of mortality and morbidity was tested using the chi-square test of associations. Risk ratios of mortality and morbidity in the high lactate patients were calculated and multiple logistic regression was done to control for the influence of age, gender oxygen saturations, MEWS >6, and GCS. In addition, duration to death was calculated and the Kaplan–Meier curve was drawn for each group. The curves were compared using the log-rank test and cox-proportional hazard ratios calculated for high lactate patients compared to the normal lactate group. Similarly, a comparison between Type A and Type B hyperlactatemia with morbidity and mortality rates was tested using the chi-square test, and the risk ratio was calculated. P = 0.05 or less was considered significant. Lactate level was an exposure variable, interpretation of lactate levels was as follows: Normal lactate was between 0.7 and 2.5, mild 2.6–3.5, moderate 3.6–5.0, severe 5.1–9.0, and very severe >10. Reference ranges from the manufactures kit.
Ethics
The study was done after authorization by the Department of Clinical Medicine and Therapeutics and the KNH/University of Nairobi Ethics and Research Committee. A letter of approval by the KNH administration was sought after KNH/ University of Nairobi (UON) Ethics and Research Committee approval.
RESULTS
Five hundred and seventy patients were screened using MEWS as a definition of critical illness. Three hundred and seven patients met the inclusion criteria, and 26 patients declined to consent and were excluded. A total of 281 patients were recruited into the study, as shown in [Figure 1].
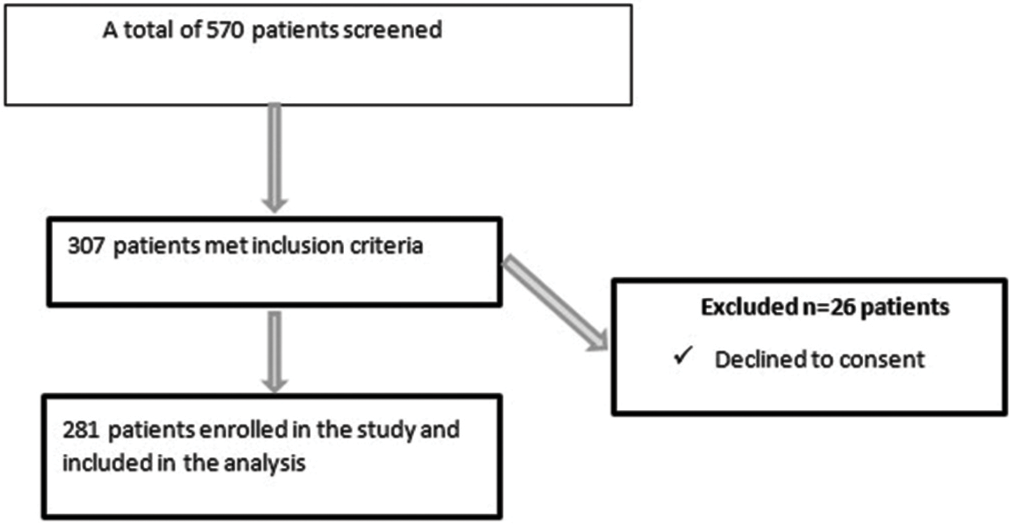
- Flow diagram of recruitment of critically ill patients at the emergency department. n: Number of patients
Demographic characteristics
The mean age was 45.6 years. Age was categorized as follows: 80.6% (227/281) were <65 years and 9.2% (54/281) were >65 years. About 54% (152/281) were male patients and 46% (129/281) were female patients, as shown in [Table 1].
| Variable | Frequency (%) n=281 |
|---|---|
| Age in years | |
| Mean (SD) | 45.6 (18.8) |
| Min–Max | 18–97 |
| Category n (%) | |
| <65 | 227 (80.6) |
| >65 | 54 (9.2) |
| Gender n (%) | |
| Male | 152 (54.1) |
| Female | 129 (45.9) |
SD: Standard deviation, n: Number of patients
Physiological parameters
Physiological parameters done at screening point were as follows, they are presented as mean. Patients were normotensive, had tachycardia, tachypnea, low temperature, and hypoxemia. Half of the patients had altered mental state. About 56 % had MEWS score >6, mean MEWS was 6.7. This is illustrated below in [Table 2].
| Variable | Mean (SD) |
|---|---|
| Systolic blood pressure (mmHg) | 133 (38.2) |
| Diastolic blood pressure (mmHg) | 80 (24.1) |
| Mean arterial pressure | 96 (27.9) |
| Heart rate (beats/minute) | 116 (25.8) |
| Respiratory rate (breaths/minute) | 29 (7.4) |
| Temperature (degrees Celsius) | 35.9 (1.1) |
| SpO2% | 89 (12.5) |
| Glasgow coma scale | n (%) |
| Mean (SD) | 12 (3.6) |
| Category, n (%) | |
| 15 | 142 (50.5) |
| 14 | 39 (13.9) |
| 9–13 | 45 (16.0) |
| <8 | 55 (19.6) |
| MEWS n (%) | |
| 5 | 125 (44.5) |
| 6 | 72 (25.6) |
| 7 | 42 (14.9) |
| 8 | 16 (5.7) |
| 9 | 18 (6.4) |
| 10 | 8 (2.8) |
SD: Standard deviation, n: Number of patients
MEWS: Modified Early Warning Score, SpO2: Oxygen saturation
POC lactate levels
The mean lactate level was 4.0 mmoL/L with a median of 3.0 mmoL/L. Lactate levels ranged from 0.3 to 20 mmoL/L. Hyperlactatemia was detected in 57.3% (161/281) of the patients. About 31.1% (50/161) of the patients had mild hyperlactatemia, 26.7% (43/161) had moderate hyperlactatemia, 32.3% (52/161) had severe hyperlactatemia, and 9.9% (16/161) of the patients had very severe hyperlactatemia of >10. These results are summarized in [Table 3].
| Variable | Frequency (%) |
|---|---|
| Lactate level | |
| Mean (SD) | 4.0 (3.4) |
| Median (IQR) | 3.0 (1.8–4.9) |
| Min–Max | 0.3–20.0 |
| Lactate level category (mmoL/L) | |
| Normal lactate<2.5 | 120 (42.7) |
| High lactate>2.5 | 161 (57.3) |
| Categories of hyperlactatemia severity (mmoL/L) | |
| Mild hyperlactatemia (2.6–3.5) | 50 (17.8) |
| Moderate hyperlactatemia (3.6–5.0) | 43 (15.3) |
| Severe hyperlactatemia (5.1–9.9) | 52 (18.5) |
| Very severe hyperlactatemia (>10) | 16 (5.7) |
| Normal | 120 (42.7) |
Mild: 2.6–3.5, Moderate: 3.6–5.0, Severe: 5.1–9.9, Very severe: >10.
IQR: Interquartile range, SD: Standard deviation
Morbidity
Association between 7-day morbidity and hyperlactatemia
Among the patients with high lactate 47.8% (77/161) required ICU admission, 40.4% (65/161) needed mechanical ventilation, and 16% (26/161) required inotropic/ vasopressors support. Patients with hyperlactatemia had higher morbidity compared to patients who had normal lactate. These results are shown in [Table 4].
| Variable | Lactate level | OR (95% CI) | P-value | |
|---|---|---|---|---|
| High (n=161) n (%) | Normal (n=120) n (%) | |||
| ICU admission | ||||
| Yes | 77 (47.8) | 35 (29.2) | 2.2 (1.3–3.7) | 0.002 |
| No | 84 (52.2) | 85 (70.8) | 1.0 | |
| Mechanical ventilation | ||||
| Yes | 65 (40.4) | 25 (20.8) | 2.6 (1.5–4.4) | 0.001 |
| No | 96 (59.6) | 95 (79.2) | 1.0 | |
| Inotropes/vasopressors | ||||
| Yes | 26 (16.1) | 8 (6.7) | 2.7 (1.2–6.2) | 0.016 |
| No | 135 (83.9) | 112 (93.3) | 1.0 | |
| Renal replacement therapy | ||||
| Yes | 12 (7.5) | 11 (9.1) | 0.8 (0.3–1.9) | 0.604 |
| No | 149 (92.5) | 109 (90.8) | 1.0 | |
| Liver replacement therapy | ||||
| Yes | 2 (1.2) | 1 (0.8) | 1.5 (0.1–16.7) | 1.000 |
| No | 159 (98.8) | 119 (99.2) | 1.0 | |
ICU: Intensive care unit, OR: Odds ratio, CI: Confidence interval, n: Number of patients, The bold number, signifies that the value was statistically significant.
All-cause mortality
The overall 7-day mortality was 33.8% (95/281). Most patients died within 24 h of hospital admission 50.5% (48/95). About 49.4% (47/95) of patients died after 24 h. Patients who survived were 66.2% (186/281).
Association between 7-day mortality and hyperlactatemia lactate cutoff 2.5
In the high lactate group, the 7-day mortality rate was 42.2% (68/161) compared to a mortality rate of 22.5% (27/120) in the normal lactate group using a cutoff of 2.5 mmoL/L (OR: 2.5, 95% CI: 1.5–4.3, P = 0.001).
Survival analysis was done using Kaplan–Meier curves, which demonstrated reduced survival in patients who had high lactate compared to normal lactate patients, this is summarized in [Figure 2] below.
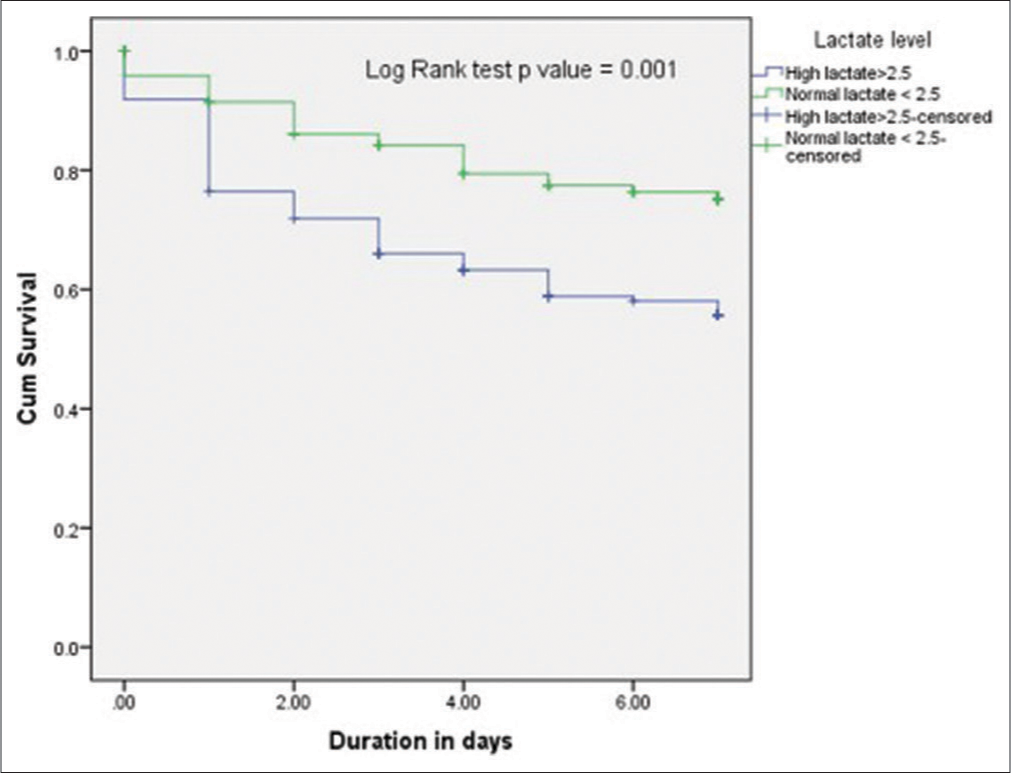
- Kaplan–Meier curves show the survival rate in patients with high lactate compared to those with normal lactate. Survival was reduced in high lactate group compared to normal lactate group P = 0.001 using log Rank test.
Association between 7-day mortality and hyperlactatemia
Mean lactate in patients who died was 5.0 mmoL/L. In the high lactate group, the 7-day mortality rate was 42.2% (68/161) compared to a mortality rate of 22.5% (120) in the normal lactate group using a cutoff of 2.5 mmoL/L. Patients who had very severe hyperlactatemia (>10 mmoL/L) had the highest mortality rate of 68% (11/16), followed by moderate hyperlactatemia 44.2% (19/24), severe hyperlactatemia 40.4% (21/31), and the lowest rate in mild hyperlactatemia category 34% (17/33). Hyperlactatemia had a dose-response, as shown in [Table 5].
| Variable | Died (n=95) | Alive (n=186) | OR (95% CI) | P-value |
|---|---|---|---|---|
| Mean lactate level in mmoL/L (SD) | 5.0 (3.9) | 3.5 (3.0) | - | 0.001 |
| Lactate (2.0–2.5) | ||||
| <2.0 | 15 (19.7) | 61 (80.3) | 1.0 | |
| 2.0–2.5 | 12 (27.3) | 32 (72.7) | 1.5 (0.6–3.6) | 0.343 |
| >2.5 | 68 (42.2) | 93 (57.8) | 3.0 (1.6–5.8) | 0.001 |
| Hyperlactatemia severity | ||||
| Normal lactate<2.5 | 27 (22.5) | 93 (77.5) | 1.0 | |
| Mild | 17 (34.0) | 33 (66.0) | 1.7 (0.9–3.7) | 0.121 |
| Moderate | 19 (44.2) | 24 (55.8) | 2.7 (1.3–5.7) | 0.008 |
| Severe | 21 (40.4) | 31 (59.6) | 2.4 (1.2–4.9) | 0.014 |
| Very severe | 11 (68.8) | 5 (31.3) | 9.5 (2.8–32.1) | <0.001 |
Patients who died with<2.5 lactate (n=27) – mean lactate 1.7 (SD 0.6), range 0.3–2.5. SD: Standard deviation, OR: Odds ratio, CI: Confidence interval, n: Number of patients, The bold number, signifies that the value was statistically significant.
Multivariate analysis using multiple logistic regression models
All the significant factors in the bivariate analysis (factors associated with mortality) were entered into the logistic regression model. These results are shown in [Table 6].
| Variable | Adjusted OR (95% CI) | P-value |
|---|---|---|
| lactate level | ||
| High >2.5 mmoL/L | 2.1(1.1–4.1) | 0.021 |
| Normal <2.5 mmoL/L | 1.0 | |
High lactate >2.5 mmoL/L was independently associated with mortality. OR: Odds ratio, CI: Confidence interval, The bold number, signifies that the value was statistically significant.
Hyperlactatemia etiology
Patients in this study had Multi-morbidity
Type A hyperlactatemia was the most common accounting for 84.3% (237), while Type B was found in 15.7% (44) of the patients. The main cause of Type A hyperlactatemia was sepsis 46% (131), followed by severe hypoxemia 34.5% (97), trauma 19.6% (55), shock 10.3% (29), severe anemia 10% (28), seizures 8.5% (24), asthmatic attacks 3.6% (10), and burns 3.2% (9). Post-cardiac arrest had only two patients while limb ischemia and compartment syndrome had one patient each. In Type B hyperlactatemia’s leading causes were malignancy and drugs at 13.2% (37) and 13.1% (37), respectively. The main drugs were metformin, nucleoside reverse transcriptase inhibitors, and beta-2 agonists. Other causes were, DKA 5% (14), and toxins included (alcohol, organophosphates, antidepressants, cannabinoids, and opiates) at 5% (14). Infection without sepsis accounted for 4.6% (13), while acute and chronic liver disease was found in 3.6% (10) of the patients, as shown in [Table 7].
| Variable | Frequency (%) | |
|---|---|---|
| Cause | ||
| Type A | 237 (84.3) | |
| Type B (only those without Type A) | 44 (15.7) | |
| Evidence of hypoxia -Type A | Sepsis documented or suspected infection | 131 (46.6) |
| Shock syndromes-SBP<90 or MAP<65MMHG | 29 (10.3) | |
| Post-cardiac arrest syndrome | 2 (0.7) | |
| Regional ischemia | ||
| Trauma | 55 (19.6) | |
| Burns | 9 (3.2) | |
| Limb ischemia | 1 (0.4) | |
| Compartment syndrome | 1 (0.4) | |
| Severe hypoxemia (SpO2 <90 OR cyanosis) | 97 (34.5) | |
| Severe anemia Hb <5 g/dL | 28 (10.0) | |
| Anaerobic muscle activity | ||
| Seizures | 24 (8.5) | |
| Excessive work of breathing (Asthma) | 10 (3.6) | |
| No hypoxia -Type B | Drugs | |
| Metformin | 17 (6.0) | |
| NRTI | 11 (3.9) | |
| Beta-2 agonist | 9 (3.2) | |
| Malignancy | 37 (13.2) | |
| Diabetes ketoacidosis | 14 (5.0) | |
| Toxins (alcohol and cocaine) | 14 (5.0) | |
| Infection without sepsis | 13 (4.6) | |
| Acute and chronic liver disease | 10 (3.6) |
Cohen and Woods classification. SBP: Systolic blood pressure, MAP: Mean arterial pressure, SpO2: Oxygen saturation, Hb: Hemoglobin, NRTI: Nucleoside reverse transcriptase inhibitors
Mortality by type of hyperlactatemia
Patients with Type A hyperlactatemia had higher mortality than patients with Type B hyperlactatemia. Type A had a mortality rate of 37.1% (OR: 3.1, 95% CI, P = 0.006) compare to a mortality rate of 15.9% in Type B. These results are summarized using a Kaplan–Meier curve in [Figure 3]. Survival rate in T ype A hyperlactatemia patients was significantly reduced compared to patients who had Type B hyperlactatemia (Log Rank test P = 0.011).
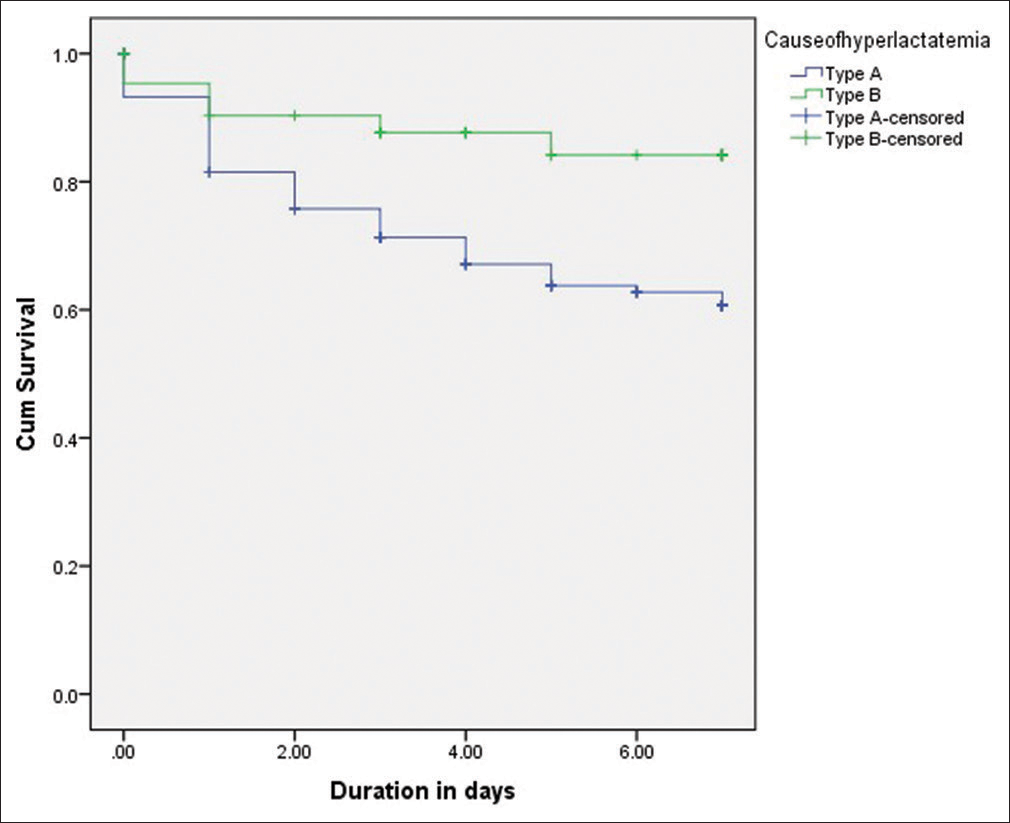
- Kaplan–Meier curves shows survival rate in Type A hyperlactatemia patients compared to Type B hyperlactatemia patients.
DISCUSSION
POC hyperlactatemia was associated with an adjusted 2.5-fold risk of death, with a 7-day mortality rate of 42% compared to 22.5% in the normal lactate group. Hyperlactatemia was similarly significantly associated with a 2.5 fold increased morbidity risk, inclusive of need for ICU admission and organ support. Type A hyperlactatemia was the most frequent type of hyperlactatemia, predominantly due to sepsis, and was associated with a 3-fold risk of death compared to Type B hyperlactatemia.
The only comparable African study is a prospective cohort undertaken in Tanzania in 2019 that reported 24-h all-cause mortality of 24% and hyperlactatemia was associated with an 8-fold relative mortality risk. The study subjects were a decade older than ours and they utilized a higher POC lactate cutoff level, which may explain the higher reported mortality risk.[12] Studies from the developed world report a similar mortality risk associated with hyperlactatemia ranging from OR of 2–3.4, despite being of various designs and utilizing different cutoff values for hyperlactatemia.[14-16] Our results demonstrate a dose response relationship in the association of hyperlactatemia with increased mortality, further enhancing the plausibility of this finding.
Our finding of increased morbidity, in terms of need for organ support, is consistent with reports from several other studies with similar magnitude of association. Netherlands study found an increased need for ICU and high-dependency unit admissions and increased length of hospital stay.[16] A study by Edward found that hyperlactatemia was associated with adverse outcomes.[12] Haas et al. found an increased need for Extra Corporeal Membrane Oxygenation and renal replacement therapy in addition to the other organ support modalities.[17]
We found Type A hyperlactatemia to be the most common type occurring in 80% of subjects, and was associated with a 3-fold risk of death compared to Type B hyperlactatemia. In Type A, hyperlactatemia sepsis was the leading cause followed by severe hypoxemia, trauma, and shock among others. A study done in the Netherlands in 2017 reported shock as the commonest cause followed by sepsis.,[16] whereas a 2015 German study found sepsis as the leading cause of hyperlactatemia.[17] The Van Den Nouland et al. study also found Type A hyperlactatemia to be the most prevalent at 80% which was similar to our study.[16] Immediate management of Type A by enhancing tissue oxygenation and perfusion is important in reducing mortality. Van Den Nouland et al. suggested that patients in the ED should be treated as Type A hyperlactatemia initially and thereafter reclassified once tissue perfusion has been enhanced. Classification according to the type of hyperlactatemia is key in the resuscitation and management of these patients.[16] To offer appropriate treatment, there is a need to reassess their response to treatment and thus reclassify appropriately. Kushimoto et al. highlighted the need for careful resuscitation due to the different mechanisms of hyperlactatemia.[18]
Our study is the first prospective study on POC lactate in critically ill patients at the ED of KNH in Kenya. It informs the need for incorporating POC lactate in triaging critically ill patients and, therefore, forestall clinical deterioration and mortality in this low-resource setting. All consecutive patients in the ED were screened for eligibility, thus, minimizing selection bias. An important limitation of the study was the possible overlap between Type A and Type B causes, patients who had mixed etiology were classified as Type A as it is the most common and carries significant mortality. This may have overestimated the prevalence of Type A hyperlactatemia. Additional limitation was the inability to undertake toxicology and thiamine deficiency studies which may have led to the underdiagnosis of Type B hyperlactatemia.
CONCLUSION
POC hyperlactatemia is an independent predictor of 7-daymorbidity and mortality and is associated with a 2-fold risk of death and need for ICU admission and organ support. Type A hyperlactatemia was the most frequent and was associated with a 3-fold risk of mortality. Sepsis was the leading cause of Type A hyperlactatemia.
Recommendation
We recommend the incorporate of POC lactate in the evaluation and triaging of critically ill patients in the ED for risk stratification and prognostication. In addition, further studies evaluating the impact of interventions on rate of lactate clearance among the critically ill are recommended.
Acknowledgment
This study received support from the IMPALA study. I wish to thank KNH, UON Department of Clinical Medicine and Therapeutics and my family for their support toward this study.
Declaration of patient consent
The authors certify that they have obtained all appropriate patient consent.
Conflicts of interest
There are no conflicts of interest.
Financial support and sponsorship
Nil.
References
- Hyperlactatemia and the importance of repeated lactate measurements in critically ill patients. Med Arch. 2017;71:404-7.
- [CrossRef] [PubMed] [Google Scholar]
- Etiology and therapeutic approach to elevated lactate levels. Mayo Clin Proc. 2013;88:1127-40.
- [CrossRef] [PubMed] [Google Scholar]
- Clinical use of lactate monitoring in critically ill patients. Ann Intensive Care. 2013;3:12.
- [CrossRef] [PubMed] [Google Scholar]
- Pathophysiology of hyperlactatemia In: Kellum J, ed. Critical Care Nephrology. United States: Saunders; 2009. p. :597-9.
- [CrossRef] [Google Scholar]
- Chronic infusion of interleukin 1 induces hyperlactatemia and altered regulation of lactate metabolism in skeletal muscle. JPEN J Parenter Enteral Nutr. 1999;23:213-7.
- [CrossRef] [PubMed] [Google Scholar]
- Predictors of mortality and prehospital monitoring limitations in blunt trauma patients. Biomed Res Int. 2015;2015:983409.
- [CrossRef] [PubMed] [Google Scholar]
- Serum lactate as a predictor of mortality in emergency department patients with infection. Ann Emerg Med. 2005;45:524-8.
- [CrossRef] [PubMed] [Google Scholar]
- Lactate clearance is a useful biomarker for the prediction of all-cause mortality in critically ill patients: A systematic review and meta-analysis. Crit Care Med. 2014;42:2118-25.
- [CrossRef] [PubMed] [Google Scholar]
- Validating a point of care lactate meter in adult patients with sepsis presenting to the emergency department of a tertiary care hospital in a low-to middle-income country. World J Emerg Med. 2017;8:184-9.
- [CrossRef] [PubMed] [Google Scholar]
- Point-of-care testing reduces length of stay in emergency department chest pain patients. Ann Emerg Med. 2005;45:587-91.
- [CrossRef] [PubMed] [Google Scholar]
- Surviving sepsis campaign: International guidelines for management of sepsis and septic shock: 2016. Intensive Care Med. 2017;43:304-77.
- [CrossRef] [PubMed] [Google Scholar]
- The utility of point of care serum lactate in predicting serious adverse outcomes among critically ill adult patients at urban emergency departments of tertiary hospitals in Tanzania. Trop Med Health. 2019;47:61.
- [CrossRef] [PubMed] [Google Scholar]
- Statistical Methods for Rates and Proportions. United States: Wiley; 2003. p. :203.
- [CrossRef] [Google Scholar]
- Blood lactate levels cutoff and mortality prediction in sepsis-time for a reappraisal? A retrospective cohort study. Shock. 2016;46:480-5.
- [CrossRef] [PubMed] [Google Scholar]
- Serum lactate upon emergency department arrival as a predictor of 30-day in-hospital mortality in an unselected population. PLoS One. 2018;13:e0190519.
- [CrossRef] [PubMed] [Google Scholar]
- Prognostic value of plasma lactate levels in a retrospective cohort presenting at a university hospital emergency department. BMJ Open. 2017;7:e011450.
- [CrossRef] [PubMed] [Google Scholar]
- Severe hyperlactatemia, lactate clearance and mortality in unselected critically ill patients. Intensive Care Med. 2016;42:202-10.
- [CrossRef] [PubMed] [Google Scholar]
- Lactate, a useful marker for disease mortality and severity but an unreliable marker of tissue hypoxia/hypoperfusion in critically ill patients. Acute Med Surg. 2016;3:293-7.
- [CrossRef] [PubMed] [Google Scholar]